|
|
The S&P500 has been on a tear and has risen from 1074 on the 4th October 2011 to 1350 presently; a rally of 25.6% in just over 4 months. It is likely that a correction is due sometime soon. However, I am sure that plenty of money has been lost in the last 2 weeks trying to pick a top to this run. There are 3 main reasons why I think that this rally will end:
1. World growth is slowing. Europe is in recession and China is still in the midst of inflation problems, which will limit their fiscal response to their growth slowdown.
2. Markets have been pricing in a pick up in US growth. Since the credit crunch began, the US has had previous periods similar to this present one; growth has looked likely to accelerate and commentators talk about exit speed (from the low growth environment). However, all previous examples have ended with the growth rate coming back to the 1.5-2% area. I do not believe that this growth spurt will be any different. The market has priced in a greater expectation than 2% growth.
3. The focus in Europe will start to move to the sustainability of Portugal and Spain's economic policies. Growth in both countries is likely to undershoot, casting doubts on their present policies and future debt issuance. I am also of the opinion that the next LTRO at the end of February will be less than the market expects. This will dampen the liquidity argument for stocks.
So when will the market top and how much is it likely to fall. Below is a chart of the S&P500 from June 2011 to now:
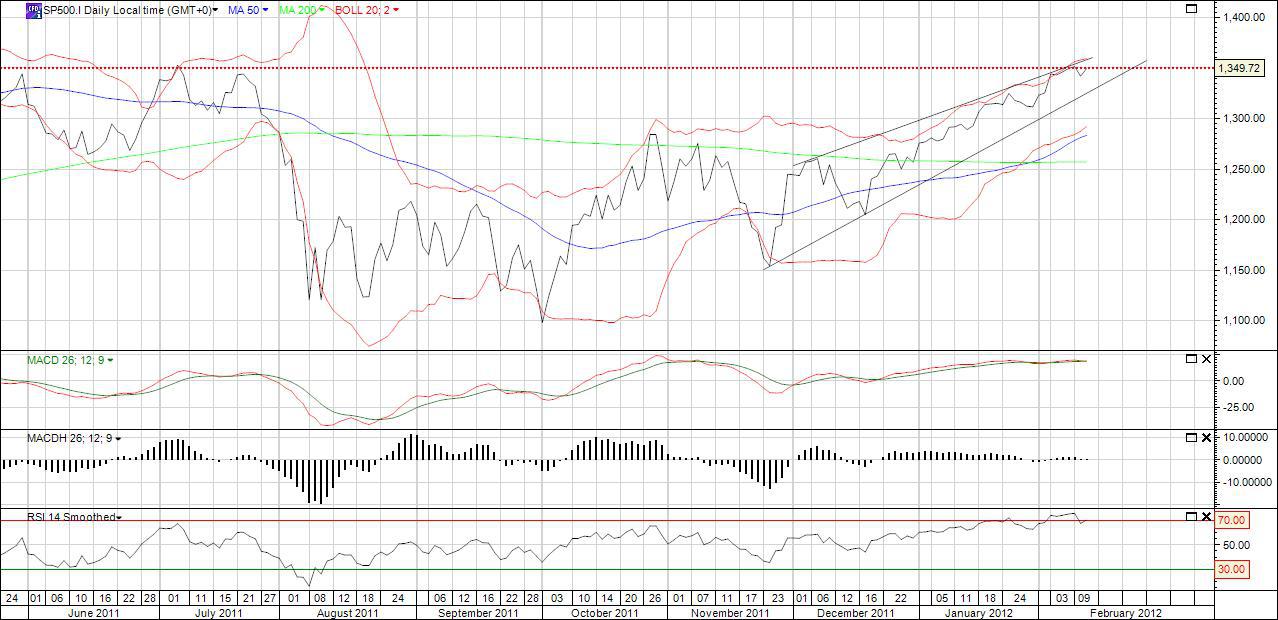
When you look at this daily chart you can see the recent rally (as a rising wedge). It is likely that a correction is due soon for the following reasons:
1. AAII sentiment is approaching over bullish readings with portfolio allocations now above 60% for stocks in most managed portfolios.
2. There is technical evidence of a market topping (MACD histogram divergence and RSI reading over 70).
3. The volume has been anemic throughout the whole of the rally, suggesting that it is not sustainable.
4. Market talk of 15,000 for the Dow by the end of the year. Bullish predictions of this type are always good contrarian indicators that positioning is getting extreme. Apple (AAPL) getting to $500 would also suggest the same.
If you buy into the above argument for a correction the 2 questions remain
1. When will the correction start
There is loads of headline risk at present from Greece, from the extension of the tax holiday, to the size of the next LTRO (and many others). Any of these headlines could start the correction. The 2011 high was at 1374 and it seems logical that this will be the next target for the market. If it were to hit that level it would be extremely overbought and due for a correction. However, it is unlikely to get there immediately so I would suggest that the next correction is likely to start some time between 1 week to 3 weeks from today (13.2.2012) and result from a failed attempt at a new high on the S&P500. The trigger could be any of the headline risks stated above.
2. How big will the correction be
Liquidity is proving to be the main mover of the markets and this is unlikely to be removed anytime soon. Any correction is therefore likely to be followed by a further rally (especially with QE3 just around the corner). The liquidity pump is likely to outdo any negative economic headlines in the medium term. For this reason I expect this will just be a correction, not a new bear market. Also the Dow and Nasdaq have both exceeded their 2011 highs, leaving the S&P500 as the laggard, but suggesting further upside in the future. There will no doubt be plenty of market participants who will see any pullback as an opportunity to get into the rally that they have missed.
So assuming that this is just a correction and that it will lead to another rally, the answer to the question "how big will the correction be?" will lie in which of the many support levels will hold and lead to the rally. The support levels that I see are:
1. 1300 (round numbers generally act as support) - A correction of 5.1% from 1370.
2. The 50 day moving average at 1282 - if this acts as support and the rally previously peters out at 1370 the correction will be 6.4%. This would also be near to a 38.2% Fibonacci retracement level of 1287 (Note 1 below).
This gives a zone of support from 1282 - 1287 for a 6.4% decline.
3. The 200 day average at 1256 - from 1370 this would be an 8.3% correction. The 50% Fibonacci retracement (as in 2) would come in at 1262.
This gives a zone of support from 1256 - 1262 for a 8.3% correction.
Conclusion
All of the above support levels seem possible to me. However, My choice is the levels around 1260. The 200 day moving average is generally reasonably strongly supported. Also, the rally has been long in duration and large in percentage terms. These types of rallies are generally followed by bigger retracements. I would suggest a correction starting between 1-3 weeks from now from 1370 to 1260 would be a reasonable prediction. However, as all experienced participants understand, predicting market moves is a mug's game! So please trade accordingly.
Notes
1. Fibonacci retracement from the rally starting on the 4th November 2011 at 1154 to it's predicted 1370 end point.
|
评分
-
1
查看全部评分
-
|

 狗仔卡
狗仔卡 发表于 2012-2-14 10:02 AM
 提升卡
提升卡 置顶卡
置顶卡 沉默卡
沉默卡 喧嚣卡
喧嚣卡 变色卡
变色卡