First American CoreLogic has released its latest residential real estate analysis here. Three important graphs from the report follow in this discussion.
Distressed Home Sales Increased in January
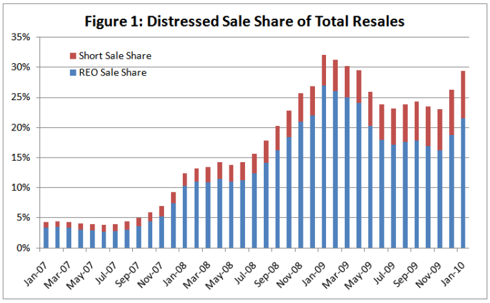
The first graph shows that distressed home sales have increased to 29% of all sales. This is high but less than a year ago.

Note the systematic increase in short sales over the past year. The volume of shorts sales is expected to be increasing further in 2010. The volume of REO sales is also likely to rise. I have estimated that REO (real estate owned) bank properties on the market in 2010 will be about 33% more in number than in 2009. If sales reflect the same increase then total sales will have to increase by 1/3 in 2010 to keep the ratio of distressed sales around 30%.
Distressed Sales Likely to Increase Share of Market in 2010
The previous discussion means the total sales in 2010 will need to rise to about 8 million, up from about 6 million in 2009. That increase is problematic. For example, it was recently pointed out that an increase of that magnitude in new home sales would require a dramatic change of trend. So most of the increase would have to come from existing home sales and these recently have been trending down.
However, pending home sales were up February, possibly signaling a three month sales volume rally into the April 30 deadline for the latest home purchase tax credit program. Whether this will be enough to put a dent in the 2 million increase in home sales needed for 2010 remains to be seen. The year over year increase in pending home sales in February was 17.6%. If this could be maintained for the balance of 2010 we would only have 1/2 of the sales increase needed to maintain distressed sales at 30%.
If 2010 home sales were to increase by 17% for 2010 over 2009 and my estimates for distressed sales are realized, approximately 35% of home sales in 2010 would be distressed properties. This would produce new highs for the graph above.
Prices Could Fall About 30% from January
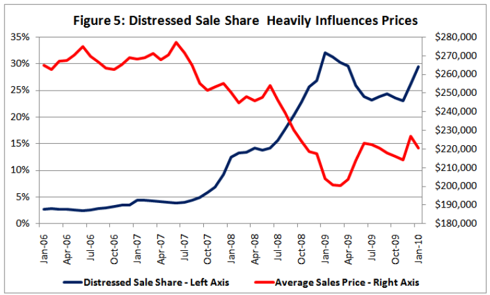
The reason the proportion of sales that are distressed is important is revealed in the second graph from First American CoreLogic:

Increasing the share of market for distressed sales to 35% implies an average sales price about 30% below January. (Note: Although not specified by First American CoreLogic, the average sales prices are very close to data published by the NAR (National Association of Realtors) data base.)
The Discount for Distressed Sales is Increasing
After dropping from a discount of about 45% three years ago to a low just above 20% in 3Q/2008, the discount for distressed sales is now averaging over 30% for the past 12 months. The trend appears to be upward. See the following graph.

If the trend to higher discount were to continue throughout 2010, the 30% estimated average price decline from January could be too small.
The wild card in these estimates is a possible shift to more sales at higher price points. If the nearly dead market for higher priced homes improves, the average price could be higher than projected. On the other hand, if upper market foreclosures and short sales increase, the discounts for distressed sales could be increased, depressing the discount more than projected.
The two wild cards would act in opposing directions on average home prices. We will have to monitor the market to see if one of the two becomes more important than the other in affecting the average home price.
Disclosure: No stocks mentioned.