|
|
12/02/2012 1:20 PM
By Carl Swenlin, Decision Point
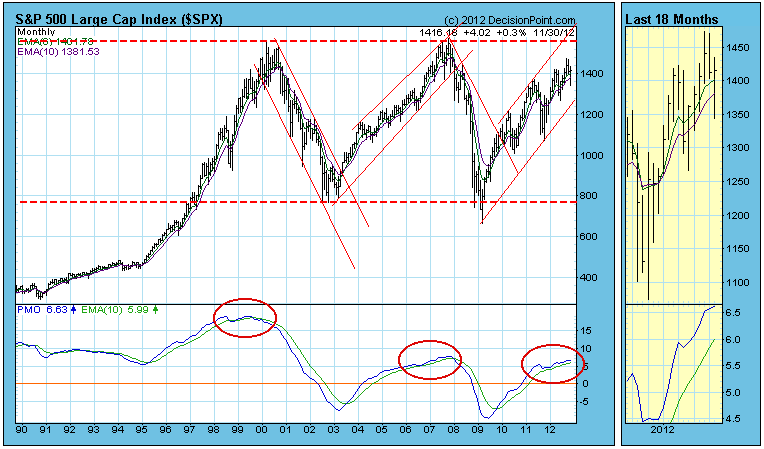
At month end we like to look at the monthly chart to refresh our long-term view of the market.
The outstanding feature on the chart is the trading range between about 750 and 1550. Two bull markets have ended their run at the top of the range, and the current bull is only about 150 points below that long-term resistance.
A bit more subtle is the current PMO (Price Momentum Oscillator) pattern. Note how it resembles the PMO patterns around the two previous major tops. This pattern plus the approach of price to long-term resistance, leads us to believe that the bull market has very little time left.
 |
评分
-
2
查看全部评分
-
|

 狗仔卡
狗仔卡 发表于 2012-12-2 06:23 PM
 提升卡
提升卡 置顶卡
置顶卡 沉默卡
沉默卡 喧嚣卡
喧嚣卡 变色卡
变色卡


 发表于 2012-12-3 12:12 AM
