
 狗仔卡
狗仔卡 发表于 2014-6-26 08:06 AM
Summary
- 7 insiders sold Gilead stock within one month.
- The stock was not purchased by any insiders in the month of intensive selling.
- 2 of these 7 insiders decreased their holdings by more than 10%.
Gilead Sciences (GILD) discovers, develops, and commercializes human therapeutics for the treatment of life threatening diseases in North America, Europe, and Asia.
(click to enlarge)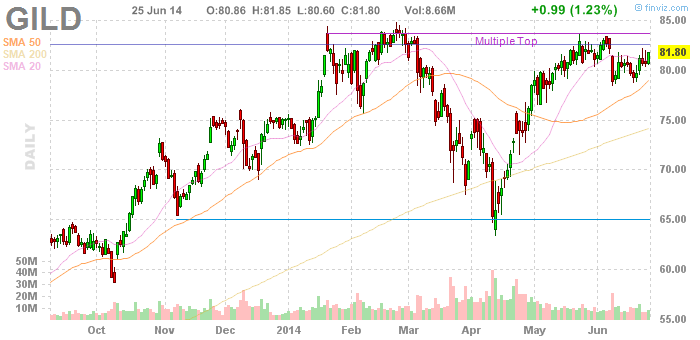
Insider selling during the last 30 days
Here is a table of Gilead's insider activity during the last 30 days.
| Name | Title | Trade Date | Shares Sold | Option Exercise & Sale | Rule 10b5-1 | Current Ownership | Decrease In Ownership |
| John Cogan | Director | June 23 | 5,000 | Yes | Yes | 42,405 shares +334,223options | 1.3% |
| Norbert Bischofberger | CSO | June 16 | 90,000 | Yes | Yes | 2,284,383 shares + 1,178,621 options | 2.5% |
| Paul Carter | EVP | June 9 | 16,728 | Yes | Yes | 30,705 shares + 57,720 options | 15.9% |
| Robin Washington | CFO | June 4 | 6,426 | No | Yes | 57,174 shares + 22,373 options | 7.5% |
| Gregg Alton | EVP | June 2 | 33,000 | Yes & No | Yes | 128,694 shares + 34,367 options | 16.8% |
| Richard Whitley | Director | June 2 | 5,000 | Yes | Yes | 15,641 shares + 128,723 options | 3.3% |
| John Martin | CEO | June 2 | 140,625 | Yes | Yes | 4,429,387 shares + 7,033,671 options | 1.2% |
There have been 296,779 shares sold by insiders during the last 30 days. All these shares were sold pursuant to a Rule 10b5-1 plan. More details about the Rule 10b5-1 trading plan can be found from this link.
Insider selling by calendar month
Here is a table of Gilead's insider activity by calendar month.
| Month | Insider selling / shares | Insider buying / shares |
| June 2014 | 296,779 | 0 |
| May 2014 | 335,953 | 0 |
| April 2014 | 270,353 | 0 |
| March 2014 | 294,353 | 0 |
| February 2014 | 454,989 | 0 |
| January 2014 | 599,225 | 0 |
| December 2013 | 477,242 | 0 |
| November 2013 | 1,676,793 | 0 |
| October 2013 | 477,242 | 0 |
| September 2013 | 537,842 | 0 |
| August 2013 | 570,962 | 0 |
| July 2013 | 713,842 | 0 |
| June 2013 | 422,242 | 0 |
| May 2013 | 312,242 | 0 |
| April 2013 | 326,210 | 0 |
| March 2013 | 416,346 | 0 |
| February 2013 | 312,242 | 10,000 |
| January 2013 | 267,671 | 0 |
There have been 8,762,528 shares sold and there have been 10,000 shares purchased by insiders since January 2013.
Financials
Gilead reported the first-quarter financial results on April 22 with the following highlights:
| Revenue | $5.0 billion |
| Net income | $2.2 billion |
| Cash | $6.4 billion |
| Debt | $9.8 billion |
The seven insiders sold their shares after these results.
(click to enlarge)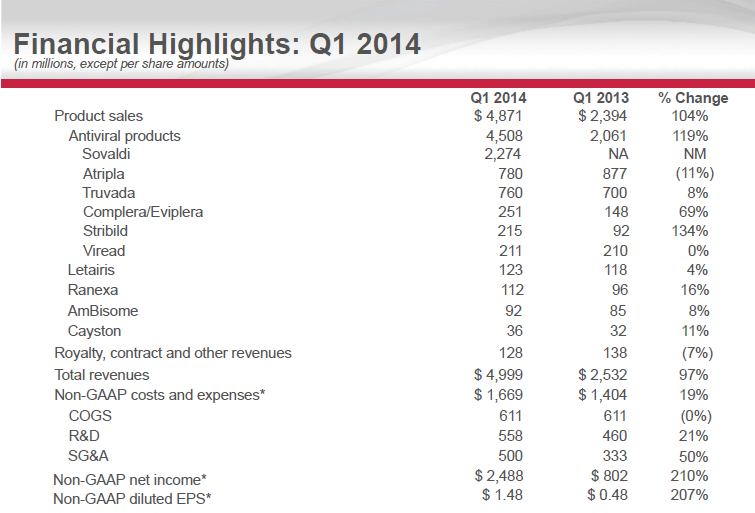
(Source: Earnings presentation)
Outlook
Gilead's guidance for the full-year 2014 is as follows:
| Net product sales | $11,300 - $11,500 million |
| Non-GAAP product gross margin | 75%-77% |
(click to enlarge)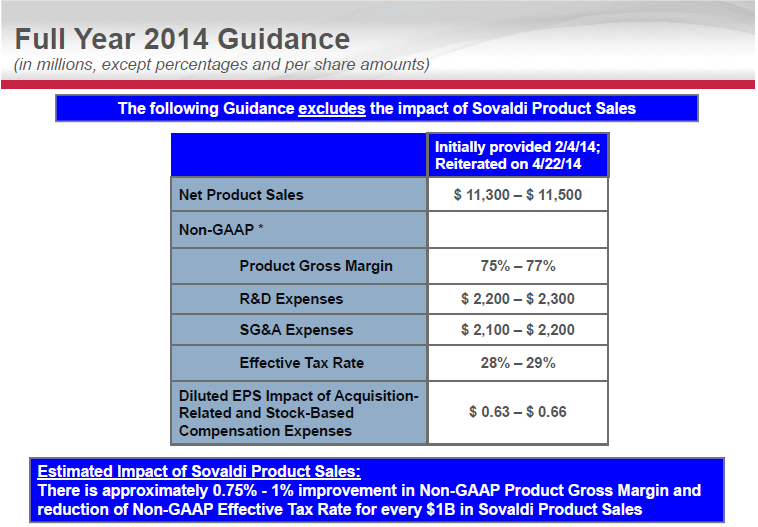
(Source: Earnings presentation)
Upcoming milestones
Gilead has the following anticipated milestones in 2014.
HIV
(click to enlarge)
(Source: Earnings presentation)
Liver Disease
(click to enlarge)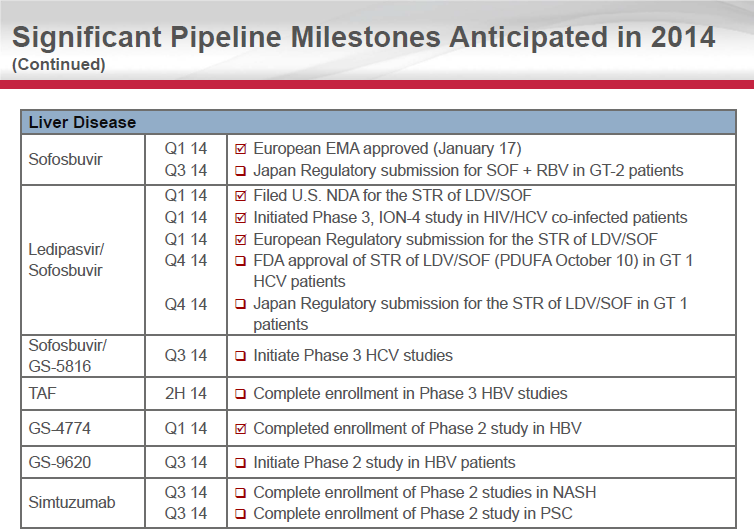
(Source: Earnings presentation)
Oncology/Inflammation & Cardiovascular
(click to enlarge)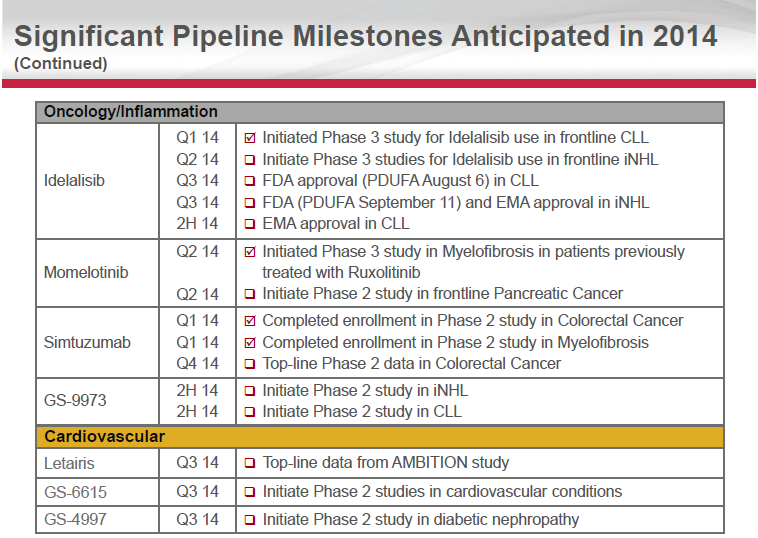 (Source: Earnings presentation)
Competition
Gilead's competitors include GlaxoSmithKline (GSK), Pfizer (PFE), andRoche (OTCQX:RHHBY). Here is a table comparing these companies.
| Company | GILD | GSK | PFE | RHHBY |
|---|---|---|---|---|
| Market Cap: | 125.62B | 128.58B | 190.09B | 249.75B |
| Employees: | 6,100 | 99,451 | 77,700 | 85,080 |
| Qtrly Rev Growth (yoy): | 0.98 | -0.13 | -0.09 | 0.01 |
| Revenue: | 13.67B | 43.69B | 50.53B | 54.37B |
| Gross Margin: | 0.78 | 0.70 | 0.82 | 0.75 |
| EBITDA: | 7.05B | 14.00B | 22.38B | 20.91B |
| Operating Margin: | 0.48 | 0.27 | 0.33 | 0.34 |
| Net Income: | 4.58B | 8.76B | 10.99B | 12.49B |
| EPS: | 2.70 | 3.52 | 3.22 | 1.80 |
| P/E: | 30.30 | 15.18 | 9.25 | 20.46 |
| PEG (5 yr expected): | 0.46 | 1.85 | 4.34 | 2.95 |
| P/S: | 9.08 | 2.96 | 3.70 | 4.60 |
Gilead has the highest P/S ratio among these four companies.
Conclusion
There have been seven different insiders selling Gilead and there have not been any insiders buying Gilead during the last 30 days. Two of these seven insiders decreased their holdings by more than 10%. Gilead has an insider ownership of 0.84%.
Before going short Gilead, I would like to get a bearish confirmation from thePoint & Figure chart. The two main reasons for the proposed short entry are a relatively high P/S ratio, and the intensive insider-selling activity.
Editor's Note: This article discusses one or more securities that do not trade on a major exchange. Please be aware of the risks associated with these stocks.
 提升卡
提升卡 置顶卡
置顶卡 沉默卡
沉默卡 喧嚣卡
喧嚣卡 变色卡
变色卡