| |

Wall St. Sentiment Weekly 9/21/08
Institutional Sentiment & Analysis
Published Sunday 9/21/2008
By Mark Steward Young
Short-Term Sentiment: Mildly Bearish after the open.
Overall Intermediate-Term Sentiment: Bullish.
Individual Investor Sentiment: Bullish for the market.
Small Speculator Sentiment: Bullish for the market.
Small Hedge Fund/Manager Sentiment: Mildly Bullish for the market.
Longer-term Trend: Bear.
Intermediate-term Trend: Neutral. Turning fast. Breadth has already turned up.
Short-term (one-day) Signal: None. We look both ways. Short, then long.
We are trading these signals and others intra-day for our Premium subscribers
--Contact us for details (WallStreetSentiment.com/contact).
Ideal ETF Portfolio (tracking portfolio):
50% long DIA at 127.54.
50% Cash
0% QLD
Watch the QLD for a turn.
The late volume tell was rather Bearish, and if they are up overnight tonight, there may be a short, but we really don't like trading the tell over the weekend. I'm just suspecting that the most fun can be had outside of the regular session tomorrow.
Results of the Wall Street Sentiment Survey (formerly known as the Fearless Forecaster Sentiment) taken after the close on 9/19/08
Response was to this question: "At the end of next week will the S & P 500 close up (bull), down (bear), or unchanged/no opinion (neutral)?"
Weekly BULLS: 48%
Weekly BEARS: 19%
Our `Smart Money' Pollees were 33% Bullish and 33% Bearish.
Our Amateur Trader Pollees were 20% Bullish and 66% Bearish.
The Senticator is mildly Bearish.
Last week, our call was for for a down open, a bit of chop and then another surprisingly strong close, then rally into Wednesday, and then chop into Friday. The market traded down hard on Monday and much higher on Tuesday, then died on Wednesday only to turn and rally into Friday. I was looking for a Down, Up, sideways type of affair, and we got some of that, but the Fed changed everything on Friday. I'm not sure how useful the call was in this environment but I think we can take a C- for that call. Remember, these predictions are for demonstration purposes and are not a substitute for trading discipline.
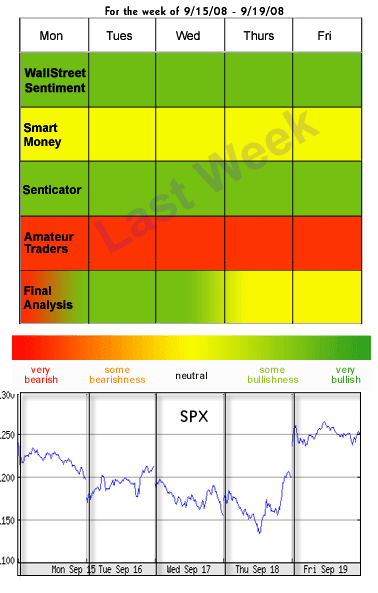
The Mechanical Senticator and the Subjective Senticator Models went long at 121.63. Both sold out at 125.03 for a better profit than our hickey last week. We'll take it. It was hard-earned. Note that the Senticator Models are based upon only one indicator and do not reflect our overall opinion. If the Senticator is Bearish or Bullish, the Mechanical model HAS to go short or long.
Proprietary Surveys
This week, the WSS Surveyees are leaning pretty heavily Bullish, but given the action that wasn't unreasonable. The "Smart Money" guys are neutral, and the "Amateur" pollees are leaning pretty Bearish again. The Senticator is mildly Bearish. The market is still news driven and manipulated right now so trading is tough, but I'm pretty sure we pull the market back a bit and I'm pretty sure that it'll be bought. There's a good chance that things will be all over the map again, but with perhaps less volatility.
Message Board Sentiment
The message board sentiment poll shows Bulls at 23% and Bears at 43%. This is Bearish since these guys tend to be right, at least short term. The Actual Position Poll shows 15% fully long and 18% partially long. 28% are partially short and 18% are fully short. This is just below my 20% threshold but not uncommon if we put in a low. Bullish for the market is the large number of partially short Bears. Last time daily Fully Long/Fully Short was above 300% and I figured that this reliable "short strength" indicator would make for a nice short a bit above the pre-open highs. That was a nice trade. We also advised that the first dip would be bought, and it was. Overall, the message board sentiment suggests that we can probably buy any pullback on Monday.
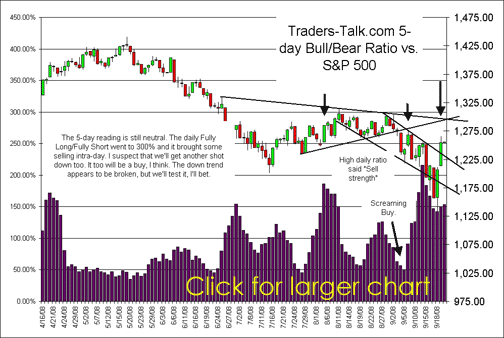
Check out www.traders-talk.com for early updates of the sentiment polls every day.
Our T-4 Turn Indicator went out at 110 which is unambiguously a signal. If yesterday's reading was a Sell then today's is a Buy. Lots of "nested signals" and high activity often mark important turns. Typically we want to see readings above 80 or higher before we look for worthwhile turns. This indicator doesn't catch every top and bottom, but it is a great "Heads up!" indicator. I'm thinking that the chop is a marker for a low somewhere in here time-wise.
Options Sentiment
Daily P/C ratio: 0.82. Sell.
10-day P/C ratio: 1.13. Weak Buy.
Equity P/C ratio: 0.51. Sell.
OEX PC ratio: 1.08. Neutral.
OEX 10-day PC ratio: 1.04. Strong Buy.
OEX $-weighted* P/C ratio: 0.37. Sell.
QQQQ $-weighted* P/C ratio: 1.33. Neutral.
ISEE Sentiment Index: 65. Strong Buy.
Relative VIX: Neutral. We got up there pretty high Thursday morning triggering a Buy. (See chart below).
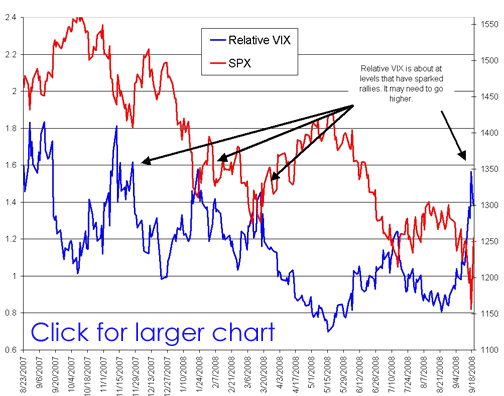
The options data are mixed, but near term more Bearish. I'd expect weakness and a quick rally. Market Harmonics' Options Buyers Sentiment Gauge (thank you, Tony Carrion http://www.market-harmonics.com) is back in Buy territory.
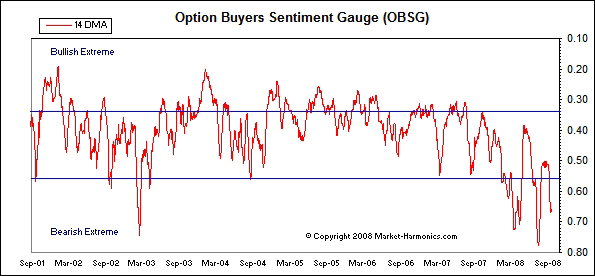
The ISEE Sentiment Index indicator is contrarian; traditionally, over 200 is too optimistic, under 100 is too pessimistic. *$-weighted P/C data courtesy of Fari Hamzei of www.hamzeianalytics.com . Readings over 2.0 are Bullish and near 0.5 are Bearish. OBSG provided by Tony Carrion of Market Harmonics.
General Public Polls
TheStreet.com had 39% Bulls and 37% Bears on very low participation. That's not much help. The lack of voting however, is a little bit Bullish. It indicates that not many are on board.
TSPTalk reported 36% Bulls and 55% Bears. That's technically a Buy by their old measures (they are re-evaluating their model, to their credit), and it's still Bullish by my rules. Last weeks 62% Bears was good news for the market.
Last week, AAII reported 27.21% Bulls and 54.42% Bears vs. 29.27% Bulls and 54.88% Bears last week. That's a solid drop in Bullishness, as we had hoped. The Bearishness was about flat, but it's pretty Bullish for the market, and solidly in Buy territory. Not over the top, yet.
Investors Intelligence reported 37.9% Bulls and 43.7% Bears which is a drop in Bullishness and a drop in Bearishness. Probably due to the constructive action the other day. It'll change if we don't rally to much this week. That's still in Buy territory, but still not particularly compelling this week. Of course, in aggregate, we've got more bearishness than we've seen in over a decade. Last week they had 38.20% Bulls and 46.6% Bears.
Mark Hulbert's HSNSI fell to -33.2% before Monday's shellacking. The average advisor is getting more Beared up. That's good news. Nasdaq advisors got really Beared up at -44.6%. This type of rising pessimism can support this market. It can, of course, go higher. In fact, barring a reversal this week, it probably will.
Lazlo Birinyi's site, Tickersense, reported that their Blogger Bulls were at 22% and Bears were at 65% which is very Bullish for the market. I don't recollect this being much more beared up. We could use a few fewer Bulls, but this is good news.
Rydex Sentiment
Our Rydex data is showed non-Dynamic Bull funds lost $20MM and non-Dynamic Bear funds lost $18MM. Confusion. No surprise. How does one trade this market at the end of day only? Dynamic Bull funds lost $4MM and Dynamic Bear funds lost $39MM. More confusion. We are finding this data of less utility and with the late release of the data, it has even less use for us. Barring a subscriber revolt, we are planning on ceasing to publish this ex post facto data. Comments welcome.
Conclusion
Last time, I was of the view that the LEH thing was a false alarm and that it was well understood and in the market. The market did bounce but then it got hit by AIG and runs on money markets. Unsurprisingly, the market did not take those problems well. On Friday, we told daily subscribers the barrage of Federal actions made it inadvisable to short for more than a quick trade (which I advised playing for, nimbly), and I advised that the first dip would be bought. We got a pullback and a rally into a decent close, but I think that the pattern will hold on a larger fractal as well. The market has turned but it's way over done and folks are confused. I would think that a bit of selling is in the works, but after that, we'll probably push higher. I'm pretty sure we'll do some sort of testing, depending upon the news and if it doesn't take the market down too far, we may have an intermediate-term low in place. As I have said, there's more than enough liquidity and bearish sentiment out there for a cyclical Bull move.
Now, the governmental actions are a real mixed bag here, and hard to understand. What I understand fairly well is that the short sale ban in the financials was a bad idea. It does nothing to really help the situation and only calls the credibility of the market into question. I've actually heard pros talk about getting out of the business due to this action. They'll likely change their mind as this action is only temporary, but the fact that Cox thought it was a good move means that the leaders at the helm are ignorant of how our market really works. Now, steps to shore up money market funds is good. These are what bank deposits were in the 30's. Shore them up or watch the system grind to a halt and for a trillion dollars to go to money heaven. These funds need to be revamped a bit and policed long term (probably by someone other than the Feds), but near term, the Feds did the right thing there. The RTC-type bail-out of the bank' toxic mortgages is NOT a good idea. Just like RTC was a bad idea. There are a lot of bad mortgages. There's also a lot of salvageable value there, so long as there is an incentive to exploit it. If the Feds take that debt in, there will be no workable salvage possible and the value destruction will be far greater. The housing mess will go on and weigh on the markets for a decade. Certainly the Feds can play a role, but this is not the right one. So, plan on a cap for the market for some time. It's well above our heads, and we've probably got a floor below, too, but it's not a great time for Buy and hold.
My call for the week is a sell-off early that is quickly bought, then a bigger sell-off that is contained and then a rally. So, down Monday into a low, up Tuesday, down Wednesday and up Thursday and Friday.
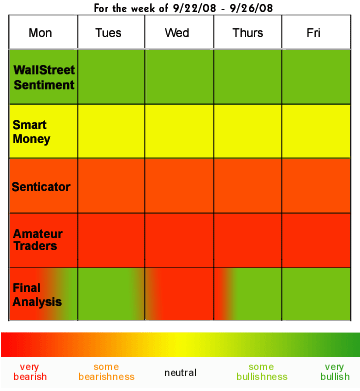
The Mechanical Senticator and the Subjective Senticator Models will go 1/2 short at the open if we are not down 10 points or more. We'll add on strength and exit if the SPY trades 2.5 points below our entry. Remember, these models must trade in the direction of the Senticator or not at all.
We do not have a ST Sentiment signal. The late volume tell was Bearish but we don't like trading over the weekend. Since we've been publishing our ST Sentiment Signals, we've had 92 trades and 64 winners. We're more active now and I'm offering more set ups when I'm not going to be around. If you'd like a trial, feel free to contact us (http://www.wallstreetsentiment.com/contact.html).
Ideal ETF Portfolio (tracking portfolio):
50% long DIA at 127.54.
50% Cash
0% QLD
We're looking to reload soon. The QLD looks interesting. Watch for an update.
Past performance is no guarantee of future returns. All information included in this missive is derived from sources we believe to be reliable, but no guarantee can be made to that effect. None of the forgoing should be construed as an offer or solicitation to buy or sell any security. The publisher may have a long or short position in the funds or securities discussed at any given time. We aren't your advisor, unless you have a signed contract with us. Please review any trade that you do with your trusted advisor FIRST.
If you'd like to receive the Wall Street Sentiment Daily as well as the Weekly Report, you'll need to make sure to order at this link (please indicate your subscriber status in the "notes"). wallstreetsentiment.com/order
If you are a KTT or Institutional subscriber, your Wall St. Sentiment Daily and Premium upgrade subscription is included.
For more on using Wall Street Sentiment and the various sentiment poll data, click here: WallStreetSentiment.com
Mark Young
Editor
ABOUT SENTIMENT AND ANALYSIS
The Wall Street Sentiment Survey is taken each Friday from a generally static pool of experienced technical analysts (both private and professional). The Wall Street Sentiment Surveyees are not normally a good fade, though there are times when they can be.
The Wall Street Sentiment Survey data are useful on the short term; they tend to be right. Typically they are right sooner rather than later, if there's a large plurality. On the flip side of the equation, if 90% or more are Bullish or Bearish, the odds of them being right over the very short term are huge, but the odds of a major turn (in the opposite direction) soon thereafter are also quite good.
We have also found that when the Wall Street Sentiment Surveyees are evenly split, look for a BIG move in either direction, but usually down.
Over the years, we have found a number of other tools to help in evaluating the Wall Street Sentiment Survey. We publish this in our Wall St. Sentiment Weekly (a part of our institutional research). These additional tools are our "Smart Money" poll, Amateur Trader survey, and our Senticator. All are proprietary surveys conducted by us.
We have found that the Senticator tends to be right by the end of the week (as much as 82.7% of the time), though it tends to be more accurate in a rising market than a falling one.
The "Smart Money" pollees are very useful when there is divergent opinion. It's generally NOT a good idea to fade the "Smart Money" unless "'EVERYONE'" (all sentiment measures) is in agreement. When in doubt about the meaning of the Wall Street Sentiment Survey, defer to the "Smart Money" poll or fade the "Amateur Survey". The "Smart Money" guys are folks with whom I've worked or whom I've watched for YEARS. They all have different approaches and they're all VERY good (not infallible, just good analysts/traders).
The Amateur Surveyees are your classic more emotional traders who tend to be wrong when they are heavily leaning in any one direction--which is often at a turning point.
In addition to these surveys, we chronicle multiple other polls and surveys including those conducted by our sister firm, Traders-Talk.com. We also review options data and fund shifts at Rydex. Additionally, we are also the sole publishers of the T-4 indicator created by Traders-talk--which is a fantastic turn indicator.
Subscriptions to Institutional Sentiment and Analysis are $99 per year. This also includes special sentiment updates and reports. Our polls are unique and insightful, and our analysis is some of the most accurate on the Street.
|